Open-source contribution
Stepwise CAPE/CIN
Designed and contributed an inflow layer visualization to the SounderPy sounding plot package.
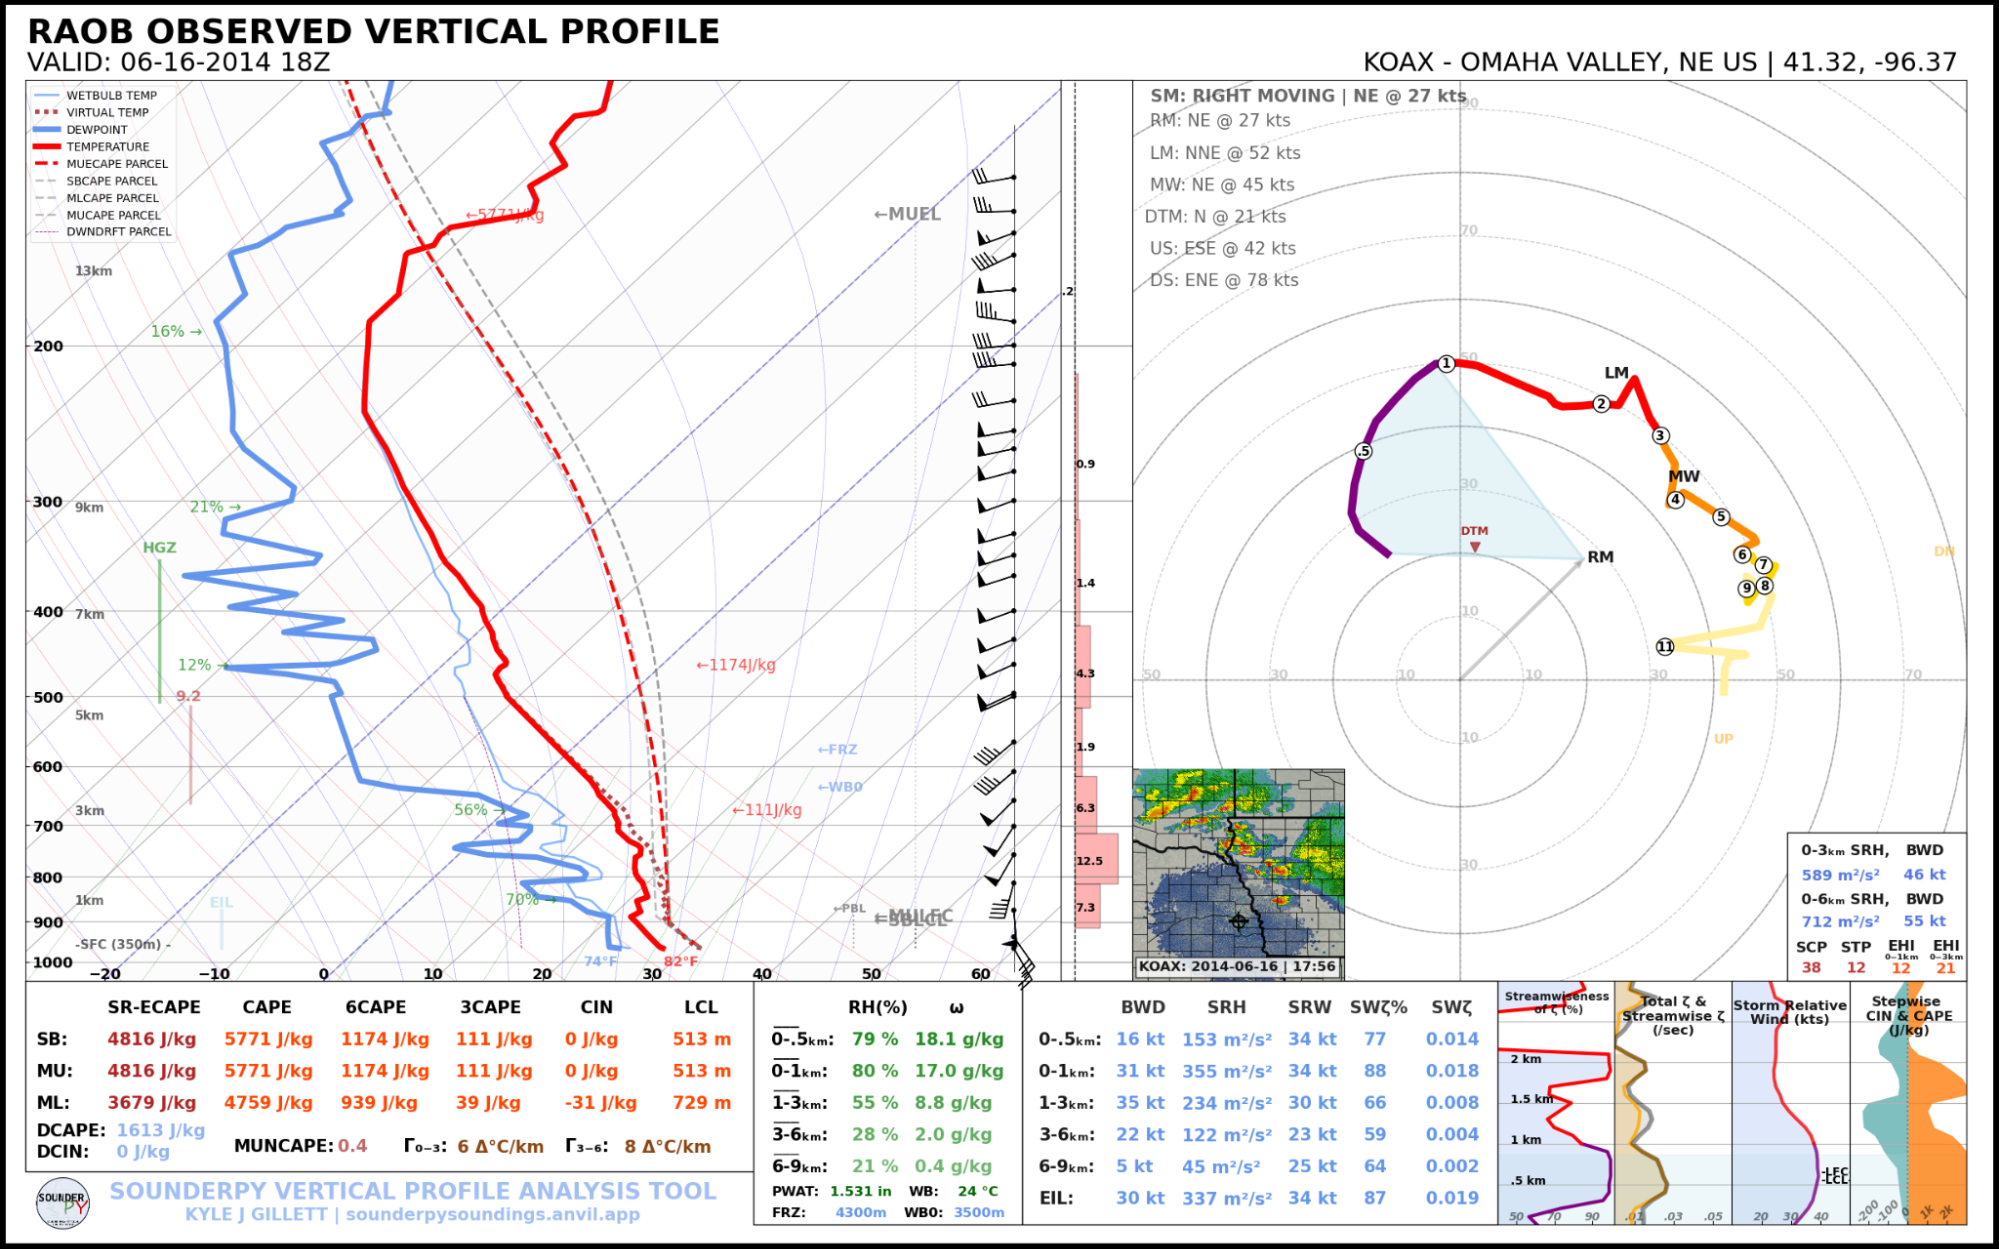
Designed and contributed a stepwise CAPE/CIN inflow layer visualization to SounderPy, a Python package used to generate sounding plots for meteorology research papers. The visualization helps determine whether an environment is likely to produce surface-based or elevated thunderstorms.
Motivation
Soundings are usually summarized with single values such as SBCAPE and MUCAPE, which can hide where a storm's inflow actually comes from. I proposed showing CAPE and CIN at every level of the atmosphere so that tornadic, "mothership," and large-hail environments can be recognized at a glance.
The plot is a way to visualize the effective inflow layer (EIL), the lowest contiguous layer of air that can feed a storm's updraft. Operational tools approximate it with a single layer, which can be misleading in elevated environments where inflow comes from one or more layers above the surface.
What it shows
- Surface-based and tornadic: a thick layer of uninhibited inflow near the surface, such as the 0-2 km layer in the 2024 Greenfield tornado environment, which is highly favorable for tornadoes.
- Elevated: inflow comes from layers above the surface, as in a sounding that produced 2.5" hail. Small amounts of CAPE can even exist above 6 km.
- Large CAPE with large surface CIN: often associated with photogenic, laminar "mothership" supercells. The stable air tends to keep tornadoes from forming, and these storms often start elevated before tapping lower-level CAPE.
Pull requests
Original inflow plot
Pull request #33 added an opt-in show_inflow option to build_sounding(), drawing CAPE, 3CAPE, and CIN at each level on the skew-T. It added about 1-2% to the runtime of build_sounding().
2023 Akron, CO supercell, which produced 27 tornadoes:
2024 messy MCS and tornado bust near Lufkin, TX, with a secondary inflow layer from 700-500 mb:
2024 Shreveport, LA tornado associated with Hurricane Beryl:
2024 Bedford, TX 2" hail event (elevated inflow):
Merged version
SounderPy's maintainer, Kyle Gillett, suggested moving the visualization into the 0-3 km vertical plots at the bottom right of the sounding, next to the kinematics, to show what a storm is actually "feeling." Pull request #34 replaced the "Theta & Theta-e" plot with "CIN & 3CAPE" and kept the original plot available behind a show_theta flag for backwards compatibility.
Compared with #33, it reduces information overload on the skew-T and is better for low-level storm behavior, at the cost of no longer showing mid- and upper-level convection.
Tornadic supercells:
Elevated supercells:
In-between cases (almost or slightly surface-based):
Kyle then refined the design with fixed axis limits (CIN down to -300 J/kg, CAPE up to 2100 J/kg) and plotted CAPE instead of 3CAPE, so that soundings can be compared directly. Because anything above about 2000 J/kg indicates severity rather than inflow structure, this range works as a cutoff. The reworked version was merged in pull request #35.